

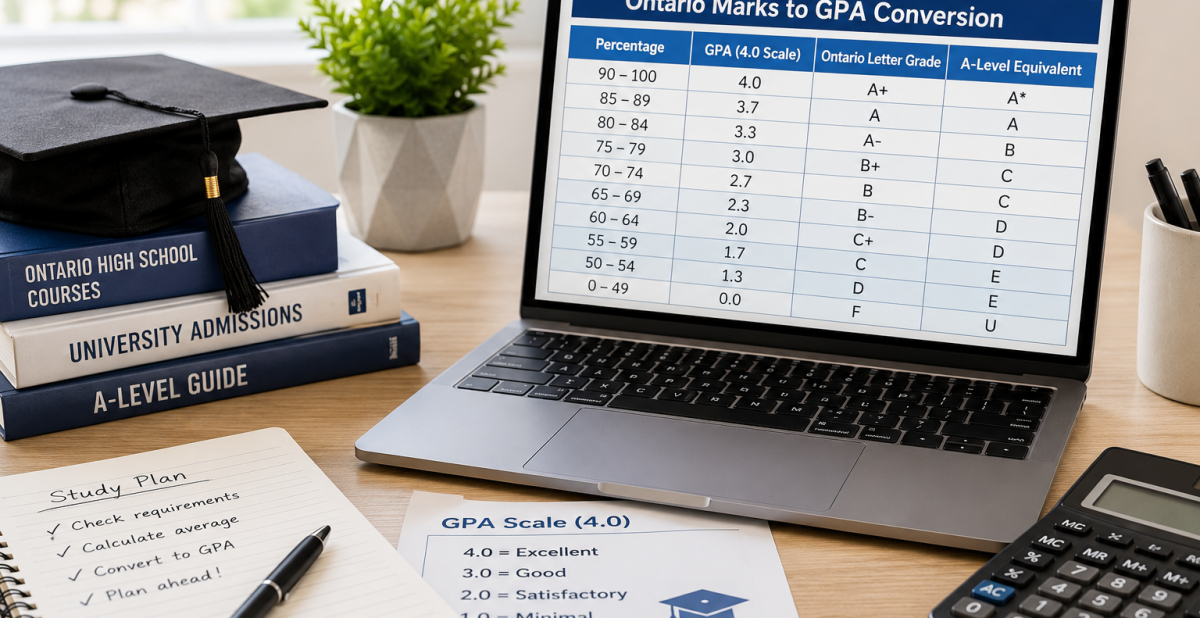
If you need an Ontario marks to GPA conversion, start here: Ontario grades in percentages from 0 to 100, not letters or GPA points, so any GPA or A-Level figure you see is an estimate, not an official score. A percentage in the high 80s to low 90s generally lines up with a 3.7 to 4.0 GPA and an A or A* at A-Level, but the exact number always depends on which institution is doing the converting. This guide gives you a full conversion table plus the honest limits of what that table can actually tell you.
Quick Answer: An Ontario mark in the 90-100% range typically converts to roughly a 4.0 GPA and an A* at A-Level, while 80-84% lines up closer to a 3.7 GPA and a solid A. Below 50% in Ontario counts as a failing mark with no credit earned, similar to an F in the US system. These figures are approximate because Ontario reports percentages, not GPA points, so every conversion table is an estimate built by the receiving institution, not an official Ontario score. Always confirm anything application-critical with an official credential evaluator like World Education Services (WES), the International Credential Assessment Service, or the specific university’s international admissions office.
Key Highlights of Ontario Marks to GPA Conversion
- Ontario uses a 0-100 percentage system for Grade 11 and 12 final marks. There is no native GPA or letter grade on an Ontario Student Transcript (OST).
- A commonly used approximate scale places 90-100% near a 4.0 GPA and 80-89% near a 3.7 GPA, but scales vary by evaluator.
- UK A-Level grades run from A* down to E, and Ontario’s 90%+ range is often treated as roughly comparable to an A*, with 80-89% closer to an A.
- UK universities frequently use UCAS Tariff points, not GPA, when setting entry requirements for A-Level applicants.
- Conversion tables are indicators only. WES, the International Credential Assessment Service, and individual university admissions offices each publish their own official scales, and they do not always match each other.
- This guide is a numeric conversion tool, different from a diploma-system comparison between the Ontario Secondary School Diploma (OSSD) and UK qualifications like GCSEs and A-Levels.
- Both incoming international students and Ontario students applying to UK or US schools need this conversion for different reasons, and this guide covers both directions.
Why This Guide Is Different From a Diploma Comparison
Before you go further, it helps to know what this guide is not. USCA Academy already has a post comparing the OSSD to GCSEs and A-Levels as full diploma systems, covering how the qualifications themselves are structured, timed, and recognized by universities.
This guide does something narrower and more numeric. It focuses only on converting an actual percentage mark into an approximate GPA figure or A-Level letter, course by course or average by average. If you want to understand how the OSSD stacks up against GCSEs and A-Levels as credentials, read that companion post first. If you already have a percentage mark and need to know roughly what it equals in GPA or A-Level terms, this guide is built for that exact question.
How Ontario Grading Actually Works
Ontario high schools do not use a GPA scale at all. Every course, from Grade 9 through Grade 12, is marked as a percentage between 0 and 100, and that percentage is what appears on the OST (Ontario Student Transcript, the official academic record).
Grade 11 and 12 final marks matter most for university applications, since Ontario universities calculate admission averages from a student’s best six Grade 12 university or university/college (U/M) level courses. That average is still expressed as a percentage, not a GPA, when a student applies through the Ontario Universities’ Application Centre (OUAC).
The absence of a GPA is exactly why conversion becomes necessary. A student applying to a US school, a UK school, or a scholarship program that expects a GPA figure needs a way to translate that percentage into a comparable number. There is no single official Ontario conversion chart for this, since the Ministry of Education does not publish one. Every conversion table you find, including the one below, was built by a receiving institution or a third-party evaluator, not by Ontario itself.
Ontario Marks to GPA Conversion Chart (Percentage to GPA & A-Level)
This table shows a commonly used approximate conversion. Treat every row as an indicator, not a guaranteed equivalency, since different institutions weight the scale slightly differently.
| Ontario Percentage | Approximate US Letter Grade | Approximate 4.0 GPA | Approximate UK A-Level |
| 90-100% | A+ | 4.0 | A* |
| 85-89% | A | 3.7 | A |
| 80-84% | A- | 3.7 | A |
| 77-79% | B+ | 3.3 | B |
| 73-76% | B | 3.0 | B |
| 70-72% | B- | 2.7 | C |
| 65-69% | C+ | 2.3 | C |
| 60-64% | C | 2.0 | D |
| 55-59% | C- | 1.7 | D |
| 50-54% | D | 1.0-1.3 | E |
| Below 50% | F (failing) | 0.0 | Not applicable, below passing |
Two things stand out in this table. First, Ontario’s failing threshold sits at 50%, so a mark of 48% earns no credit at all, comparable to an F in a US transcript. Second, the gap between an A- and a B+ in this scale is only three percentage points (80-84% versus 77-79%), which shows how sensitive a GPA conversion is to a handful of raw marks.
A Second Real-World Example: Why Tables Do Not Always Match
To show why “the table is an indicator, not an official score” is not just a disclaimer, compare the table above to a different scale actually used by a major credential evaluator. WES, a NACES-recognized (National Association of Credential Evaluation Services) evaluation service commonly used for Canadian secondary credentials, applies its own scale to Ontario-style percentages.
Under a WES-style scale, marks from 85-100% are treated as a 4.0, 75-84% as roughly 3.3, and 70-74% as a 3.0, with different breakpoints than the table above. Neither table is wrong. They are simply two different institutions drawing their own lines across the same set of Ontario percentages.
This is the entire reason official evaluators exist. If you need a GPA figure for a scholarship application, a transfer credit request, or a US university admission file, the number a school or agency actually uses in their decision is the one from their own official conversion, not from a general guide like this one.
What UK A-Level Grades Mean for an Ontario Percentage
A-Level grades in the UK run from A* (the highest) down through A, B, C, D, and E. Ontario’s 90%+ range is commonly treated as roughly equivalent to an A*, with the 80-89% range landing closer to a straight A, though the exact cutoff depends on the receiving institution.
Where this gets more complicated is that most UK universities do not actually use GPA or a simple letter match for admissions. They use the UCAS Tariff, a points system where each A-Level grade carries a fixed point value: A* is worth 56 points, A is 48, B is 40, C is 32, D is 24, and E is 16. Three A-Levels at AAA total 144 points, for example.
If you are an Ontario student applying to a UK university, your percentage average may need to be translated into an equivalent A-Level profile before it can be converted again into Tariff points. Some UK universities publish their own Canada-specific entry requirements stated directly in percentages, which sidesteps the A-Level conversion step entirely. Always check the specific university’s international entry requirements page rather than assuming a generic A-Level equivalency applies to your application.
For International Students Arriving in Ontario
If you are transferring into Ontario from a UK, US, or other international curriculum, this conversion works in reverse for you. Your home GPA or A-Level result needs to be understood in Ontario percentage terms so a Canadian high school can place you into the right courses and grade level.
A UK student with mostly A and A* grades typically places into Ontario’s upper percentage bands, often in the 80-100% range, for equivalent subject areas. A US student with a GPA around 3.7 to 4.0 sits in a similar range for placement purposes.
This placement conversion is not the same exercise as an admissions GPA conversion, and schools apply their own judgment alongside any table. USCA Academy’s guidance team works with incoming students from more than 40 nationalities and uses transcripts, course descriptions, and sometimes placement assessments together, not a single conversion number in isolation.
For Ontario Students Applying to US or UK Universities
If you are an Ontario student heading the other direction, applying to a US or UK school, you are the one who needs to explain your percentage average in terms the receiving school expects. A few practical points make this easier.
Do not calculate your own official GPA for a formal application. Many US universities and scholarship programs require a GPA from a recognized evaluator, not a self-calculated estimate, especially for anything competitive. Submitting your own math instead of an official evaluation can slow down or complicate a file review.
Check whether the school accepts percentages directly. A growing number of US and UK universities publish country-specific entry requirements for Ontario or Canadian applicants stated as raw percentages, which removes the need for a GPA conversion altogether.
Keep your OUAC-calculated admission average separate from any GPA conversion. Your Ontario admission average, based on your best six Grade 12 U/M courses, is a different number built for a different purpose than a GPA an international evaluator might generate from your full transcript.
Ask the specific program, not a general forum, when marks look borderline. A 79% sits right at the edge between a B+ and a B on most tables, and that edge can matter for a competitive program’s cutoff.
Honest Limitations: What This Conversion Table Cannot Tell You
Being upfront about what a conversion table cannot do is more useful than pretending it is precise. Here are the real limits.
No official Ontario conversion exists. The Ontario Ministry of Education does not publish a percentage-to-GPA or percentage-to-A-Level chart. Every table, including this one, is built by an outside institution or evaluator applying its own judgment.
Different evaluators produce different numbers for the same mark. As shown above, an 82% can land as a 3.7 on one scale and closer to a 3.3 on another, depending entirely on which organization’s breakpoints are used.
Course difficulty and weighting are not reflected in a flat percentage-to-GPA table. A 78% in a Grade 12 university-level (U) course like MHF4U (Advanced Functions) does not carry the same academic weight as a 78% in an introductory elective, but a simple conversion table treats both marks identically.
A-Level and Ontario courses are not structured the same way, so subject-by-subject matching is imperfect. A-Level students typically take three or four subjects in depth over two years, while Ontario students take a broader course load. Comparing a single A-Level grade to a single Ontario course mark ignores that structural difference.
Scholarship and admissions committees may recalculate your GPA using their own formula regardless of any table you present. Submitting your own conversion does not guarantee it matches what the committee’s official system produces.
Because of these limits, treat every number in this guide as a planning tool, not a guarantee. When a decision is actually application-critical, whether it is university admission, a scholarship, or a transfer credit, get an official evaluation instead of relying on any general conversion chart, including this one.
When You Actually Need an Official Credential Evaluation
Some situations call for more than an estimate. Use an official credential evaluator, not a general guide, in these cases.
A US university or scholarship program explicitly requires a GPA from a NACES-recognized evaluator like WES as part of the application file. A UK university asks for a formal equivalency statement rather than accepting a raw Ontario percentage directly. A transfer credit request depends on an exact, defensible GPA figure that a school’s admissions office will audit. A professional licensing body outside Canada requires a certified transcript evaluation rather than a student-submitted table.
In every one of these situations, contact the evaluator or the university’s international admissions office directly and ask which conversion method they use before you submit anything. Doing this early avoids a scramble close to a deadline.
Where USCA Academy Fits Into This Picture
Understanding how your Ontario percentage translates abroad matters most when it connects back to the courses you are actually taking. USCA Academy is an Ontario Ministry-inspected international private school in Mississauga offering Grades 1 through 12, with Grade 11 and Grade 12 course options built around the OSSD (Ontario Secondary School Diploma).
Because USCA Academy’s guidance team works with class sizes of 5 to 15 students and students from more than 40 nationalities, they see this conversion question from both directions constantly. A student arriving from a UK curriculum needs their A-Level or GCSE background placed correctly into Ontario percentage bands, while a graduating Ontario student needs help explaining a percentage average to a US or UK admissions office. USCA Academy’s University Preparation Program and OUAC application guidance connect directly to this, since a strong Grade 12 admission average matters whether the destination is an Ontario university or a school abroad.
For students who want to strengthen a specific mark before it becomes part of an international conversion, USCA Academy’s tutoring program and credit courses support both in-person and online study. Students catching up on a specific course, or upgrading a mark ahead of an application cycle, can also use USCA Academy’s summer school program, which runs two intakes in July and August 2026, or the night school program in Mississauga during the regular school year. Full details on every available subject sit in USCA Academy’s complete course catalogue.
Frequently Asked Questions
1.Does Ontario have an official GPA scale?
No. Ontario reports final marks as percentages from 0 to 100 on the Ontario Student Transcript. Any GPA figure you see is a conversion built by an outside institution, not an official Ontario scale.
2.What percentage is considered an A in Ontario compared to the US system?
Marks from 85-89% are commonly treated as roughly equivalent to a US A, while 90-100% often lines up closer to an A+. Exact cutoffs vary depending on which school or evaluator is doing the conversion.
3.Is a 75% in Ontario a good mark for a UK university application?
A 75% typically sits in the B range on most conversion tables, which can be competitive for some programs but below the threshold for highly selective UK courses. Check the specific university’s stated entry requirements for Canadian or Ontario applicants directly.
4.Can I submit my own GPA calculation instead of getting an official evaluation?
For anything application-critical, such as a competitive scholarship or a formal transfer credit request, use a recognized evaluator like WES or the International Credential Assessment Service instead of a self-calculated figure. Many programs specifically require this.
5.How is this guide different from a comparison of OSSD and UK qualifications?
This guide converts individual percentage marks into approximate GPA and A-Level figures. A separate USCA Academy post compares the OSSD to GCSEs and A-Levels as full diploma systems, which is a different, broader question.
6.Do Ontario universities use GPA or A-Level conversions when reviewing applications?
No. Ontario universities calculate admission averages directly from a student’s best six Grade 12 U/M percentage marks through OUAC. GPA and A-Level conversions matter for applications outside Ontario, not for Ontario’s own admission process.